
Just set up Cisco Secure Network Analytics (Stealthwatch) and wondering how to spot trouble in your network? You’re not alone! This powerful NDR tool is great at catching threats, but it needs your help to know what’s normal—and what’s not. Defining abnormal traffic can feel daunting, especially if you’re new to customizing rules. Don’t sweat it—here’s a simple guide to get you started, from setting baselines to tweaking rules, so you can make Stealthwatch work for your network.

Step 1: Understand What’s Normal on Your Network
Before you can spot abnormal activity, you need to know what’s normal. Since your Cisco system is new, it’s time to let it observe your network and gather data. Here’s what to focus on:
- Traffic Patterns: Look at the usual amounts of data moving around, the types of traffic (like web browsing or file transfers), and whether it’s coming in, going out, or moving between internal devices.
- User Behavior: Check when users typically log in, what resources (e.g., servers, apps) they access, and how much data they move.
- Device Behavior: See how devices (like servers or workstations) normally talk to each other or to outside systems.
How to Start:
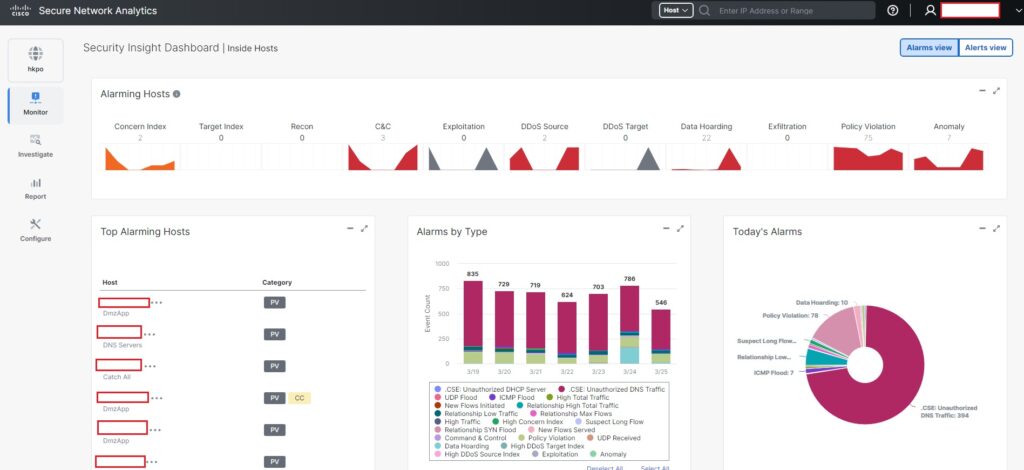
- Let Cisco Secure Network Analytics run for a few days or a week to collect data. You can find this info in the dashboards or reports section of the tool. Look for patterns—like “traffic peaks at 10 AM” or “this server only talks to these five devices.”
Step 2: Set a Baseline for Normal Activity
A baseline is like a snapshot of what’s normal, so you can spot when something’s off. Here’s how to set it up:
- Use Data: Look at the historical data your system has collected. For example, if a server sends 100MB of data per day on average, that’s your starting point.
- Set Limits: Decide what’s “too much” or “too little.” A simple way is to add a buffer—say, if normal is 100MB, anything over 150MB or under 50MB might be unusual.
- Let Cisco Help: The tool has built-in machine learning that can figure out baselines for you over time. For now, you can manually set some basic limits and let it refine them later.
How to Start:
- Go to the configuration settings in Cisco Secure Network Analytics. Look for options like “baseline settings” or “traffic thresholds.” Set some basic rules, like “alert me if traffic doubles the daily average.”
Step 3: Define Abnormal Activity
Abnormal activity is anything that doesn’t fit your baseline. Here’s what to watch for:
- Big Changes: If traffic or access spikes way beyond normal—like a user downloading 10 times their usual data—that’s a red flag.
- Weird Patterns: Look for odd behavior, like logins at 3 AM when everyone’s usually offline, or a device suddenly talking to an unknown external IP.
- Rule Breakers: Anything that goes against your security rules, like someone trying to access a server they shouldn’t.
How to Start:
- Think of a few obvious “abnormal” scenarios in your network. For example, “no one should upload huge files at midnight” or “this server shouldn’t connect to the internet.” These ideas will guide your rules.
Step 4: Customize Your Rule Sets
Cisco comes with default rules to catch common issues (like malware or data leaks), but you’ll need to tweak them for your network. Here’s how:
- Start with Defaults: Use Cisco’s built-in rules as your foundation—they’re already set to catch things like unusual traffic spikes or suspicious connections.
- Make Them Yours: Adjust the rules to match your baselines. For example, if the default rule says “alert on 1GB of outbound data,” but your normal is 100MB, lower it to 200MB.
- Focus on What Matters: Prioritize key areas—like your main database or remote access points—where abnormal access could hurt the most.
How to Start:
- In Cisco Secure Network Analytics, find the “Policies” or “Rules” section. Look at the default rules and pick a few to edit. For example:
- Change “Traffic Volume Alert” from a generic threshold to something based on your baseline (e.g., “alert if outbound traffic > 150MB/day”).
- Add a rule like “flag logins outside 9 AM–5 PM.”
Step 5: Keep Watching and Fine tune
Your network will change—new users, new apps—so your baselines and rules need to evolve too.
- Check Regularly: Look at your alerts weekly. Are you getting too many? Too few? Adjust your thresholds.
- Learn from Alerts: If an alert turns out to be nothing (a false positive), tweak the rule so it doesn’t happen again.
- Stay Updated: As you learn more about your network, make your rules smarter.
How to Start:
- After a week, check the “Alerts” or “Incidents” tab. If you see 50 alerts for something normal (like a big file transfer during work hours), raise that threshold a bit.
Practical Example
Let’s say your server normally sends 100MB of data daily, and you set a baseline with a 50MB buffer (so 150MB is the limit). If it suddenly sends 200MB, Cisco can alert you—maybe someone’s trying to steal data. Or, if users log in from 9 AM to 5 PM, a 2 AM login could trigger a “possible breach” warning.
Where to Get Help
- Cisco Documentation: Check the official Cisco Secure Network Analytics guide (online or in the tool) for exact steps on setting baselines and rules.
- Support: Reach out to Cisco’s support team or community forums if you’re stuck—they’ve got tips from other users like you.
Your Next Steps
- Collect Data: Let the system run for a few days to see what’s normal.
- Set Simple Baselines: Pick a couple of metrics (like traffic volume or login times) and set basic limits.
- Tweak a Rule: Open the rules section, adjust one default rule (e.g., traffic threshold), and test it.
- Watch and Learn: Check alerts after a week and refine as needed.
You don’t need to get it perfect right away—just start small, and Cisco’s tools will help you improve over time. Let me know if you need help with any specific part!
This should give you a solid foundation to define abnormal activity and customize your rule sets in Cisco Secure Network Analytics!